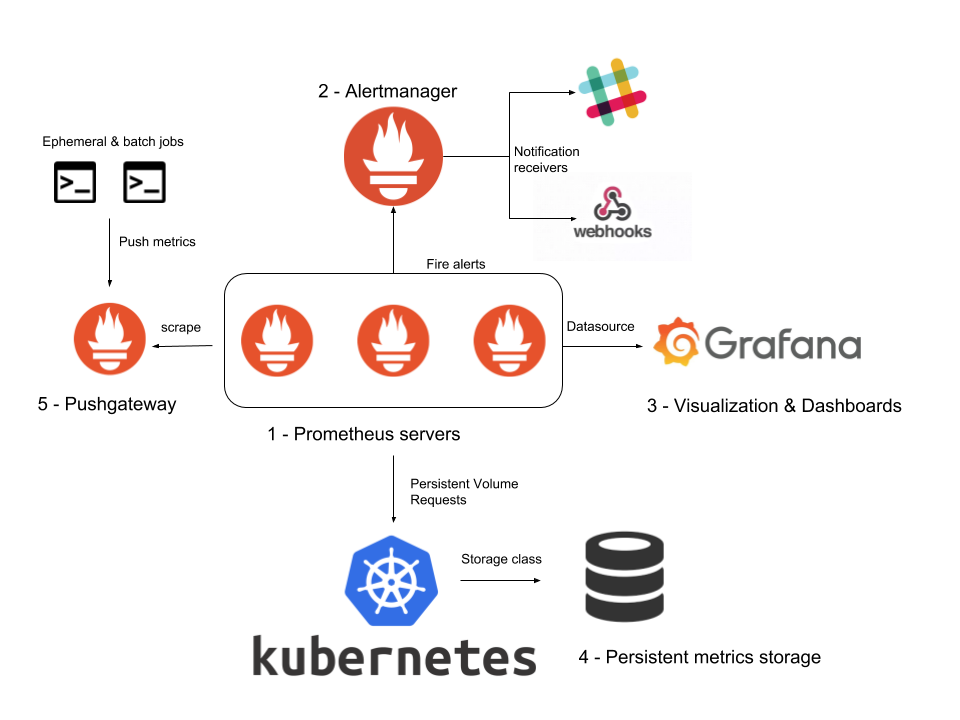

1. prometheus 설치
다운로드 : https://prometheus.io/download
Prometheus - Monitoring system & time series database
Some of our users include:
prometheus.io
현재 최신 2.5.12 버전 다운로드
tar -xzf prometheus-2.15.2.linux-amd64.tar.gz
cd prometheus-*.linux-amd64
2. prometheus config 파일 설정
global:
scrape_interval: 10s
scrape_configs:
- job_name: prometheus
static_configs:
- targets:
- localhost: 9090
web url 접속 : http://localhost:9090
3. node exporter 설치
cpu, mem, disk space, disk i/o 등 linux 시스템에 대한 모니터링
prometheus 다운로드 위치에서 node exporter 다운로드
tar -xzf node_exporter-*.linux-amd64.tar.gz
cd node_exporter-*.linux-amd64/
./node_exporter
4. prometheus에 node exporter 모니터링 추가
prometheus.yml에 scrape를 할수 있는 job 등록
scrape_configs:
- job_name: prometheus
static_configs:
- targets:
- localhost: 9090
- job_name: node # node exporter 모니터링 설정
static_configs:
- targets:
- localhost: 9100
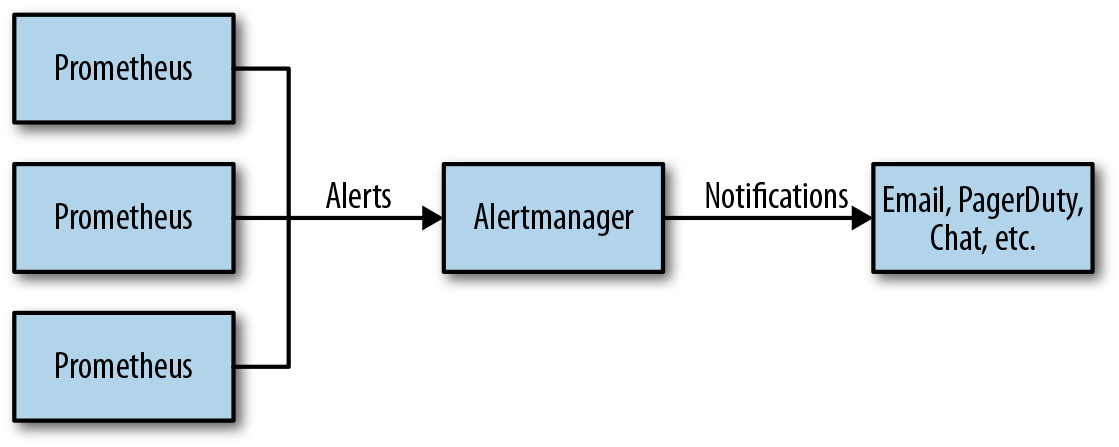
5. alertmanager 설치
prometheus 다운로드 사이트에서 alert exporter 다운로드
tar -xzf alertmanager-*.linux-amd64.tar.gz
cd alertmanager-*.linux-amd64/
# prometheus.yml에 alert 설정
alerting:
alertmanagers:
- static_configs:
- targets: ['localhost:9093']
6. alert 설정
1) smtp 설정 ( alertmanager.yml )
global:
smtp_smarthost: 'localhost:25'
smtp_from: 'test@test.com'
route:
receiver: test-email
receivers:
- name: test-email
email_configs:
- to: 'test@test.com'
./alertmanager
7. application monitoring
python3으로 application 모니터링 수행
1) python prometheus client 설치
pip install prometheus_client
2) simple program
import http.server
from prometheus_client import start_http_server
class THandler(http.server.BaseHTTPRequestHandler):
def do_GET(self):
self.send_response(200)
self.end_headers()
self.wfile.write(b"Hello Prometheus")
if __name__ == "__main__":
start_http_server(8000)
server = http.server.HTTPServer('localhost', 8001), THandler)
server.serve_forever()
3) prometheus.yml 설정
global:
scape_interval: 10s
scape_configs:
- job_name : test
static_configs:
- targets: ['localhost:8000']
8. PromQL
# instance 제외하고 device가 eth0인 5분 단위 값
sum without(instance)(rate(node_network_receive_bytes_total{device="eth0"}[5m]))
- without : label를 제거 하고자 할때
sum without(fstype, mountpoint)(node_filesystem_size_bytes)
- by : label를 유지하고자 할때
sum by(job, instance, device)(node_filesystem_size_bytes)
- sum
- count
- avg
- min / max
- 비교
count without(job, instance, device)(node_filesystem_size_bytes > 1024)
node_filesystem_size_bytes > bool 1024
'기타' 카테고리의 다른 글
| type script (0) | 2020.11.30 |
|---|---|
| Spring Cloud Netfix (0) | 2020.03.12 |
| ansible library 확장 (0) | 2019.09.13 |
| ansible 소스 설치 (0) | 2019.09.12 |
| node js gc (0) | 2019.05.19 |